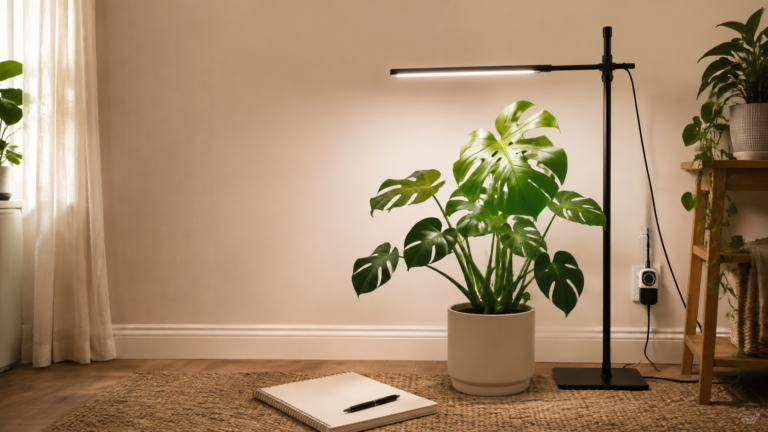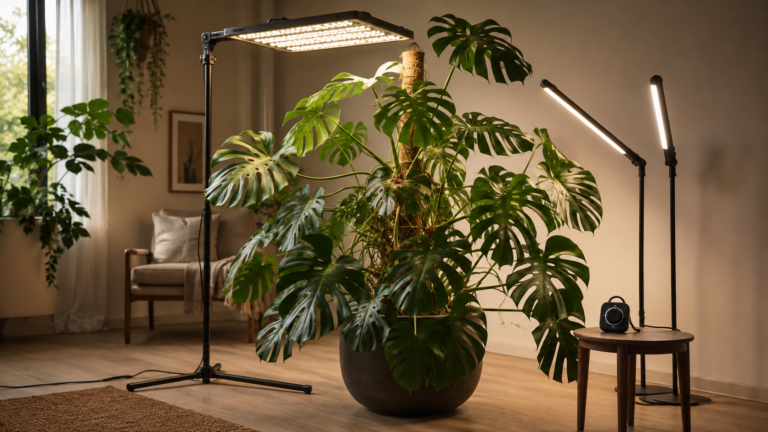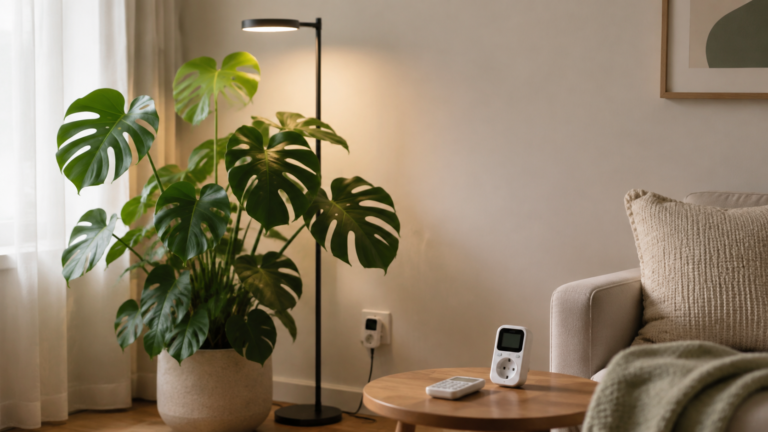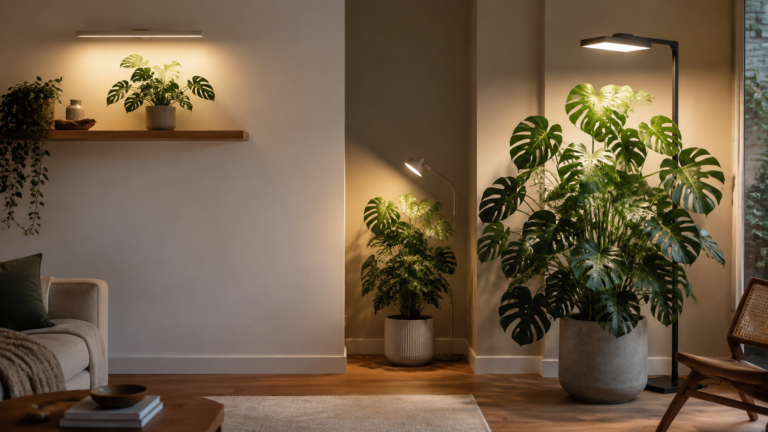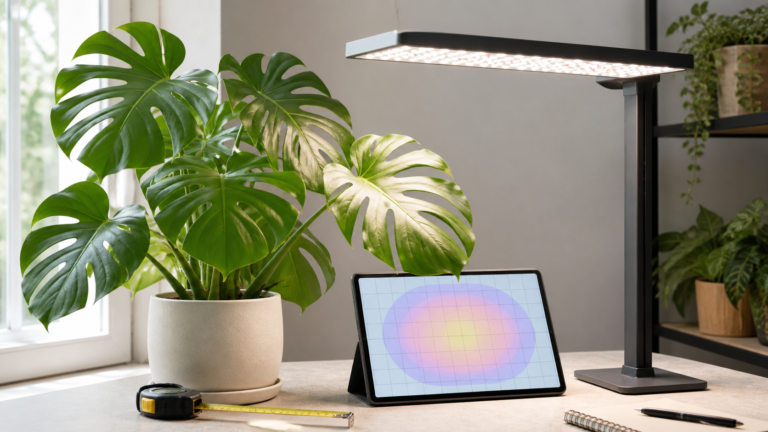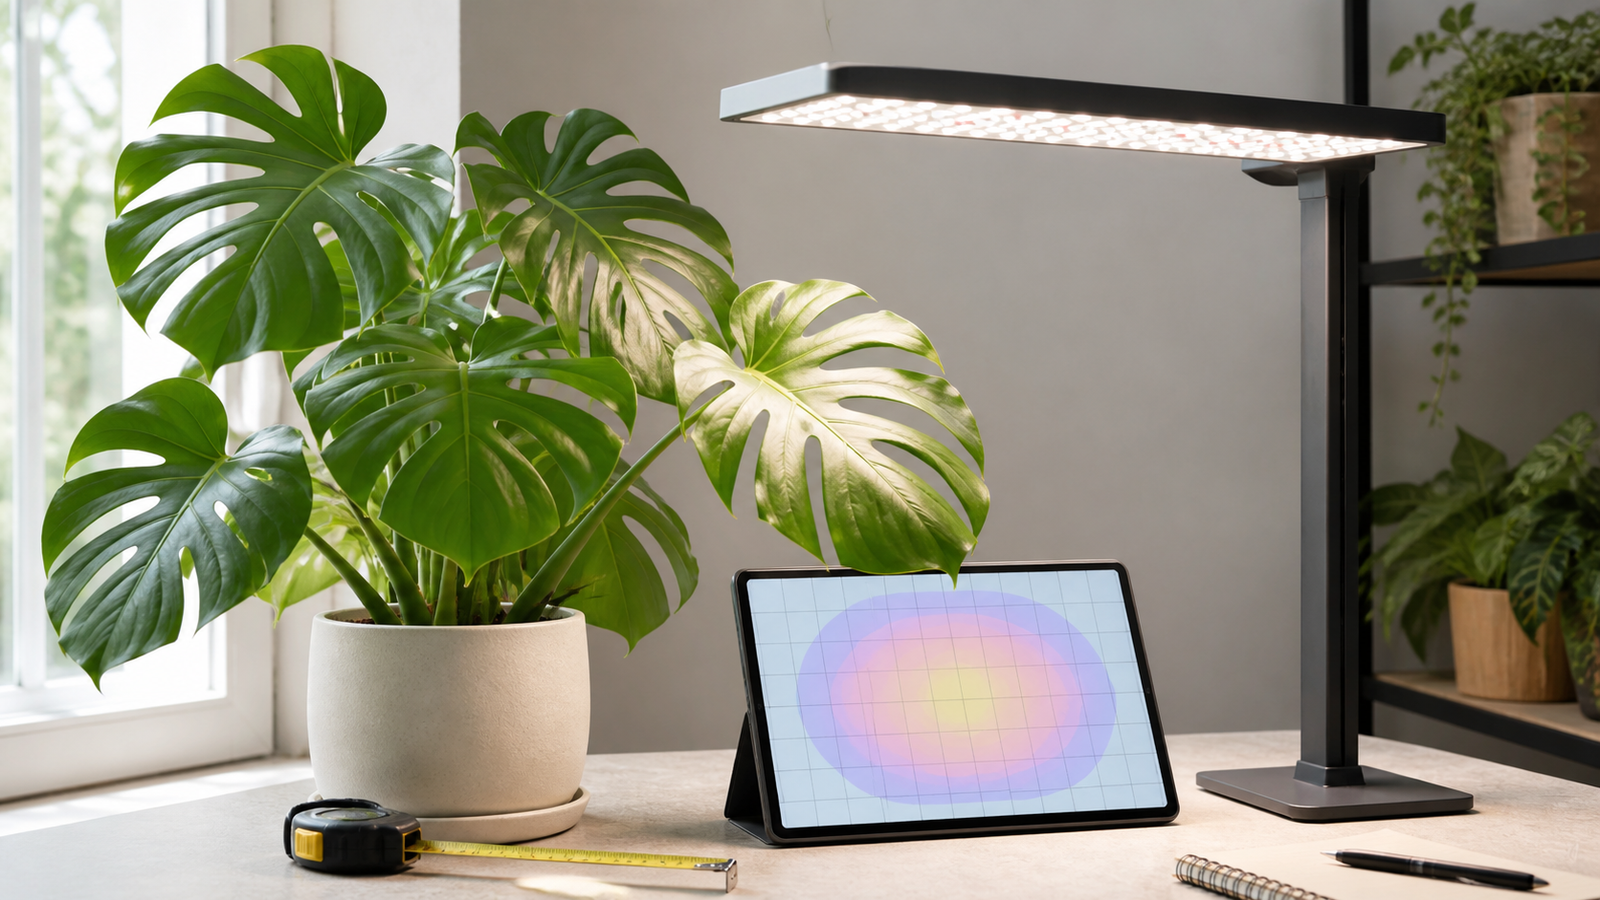
A grow-light PPFD chart shows how much usable light reaches a surface at specific points and distances. To read it before buying, match the chart's height, grid footprint, center-to-edge spread, and dimming setting to your Monstera canopy—not to the fixture's wattage or its brightest single number.
Buying a grow light from a product photo is tempting, especially when every listing promises a “full spectrum” result. A PPFD chart gives you a more useful reality check: it shows where photons land, how quickly intensity falls away from the center, and what changes when the fixture is moved. This guide explains the chart in plain language, then turns it into a repeatable buying and setup process.
Table of Contents
- What does PPFD measure for a Monstera grow light?
- Which parts of a PPFD chart should you read first?
- How do distance and mounting height change the chart?
- How do you compare center, edge, and average values?
- How should dimming and light hours change your reading?
- How can you compare two fixtures fairly?
- What red flags make a PPFD chart hard to trust?
- How do you test the chart in your own room?
- What should you check before changing the light?
- Conclusion: buy the chart that matches your canopy
- Frequently Asked Questions
- References
What does PPFD measure for a Monstera grow light?
PPFD (photosynthetic photon flux density) is the number of photosynthetically useful photons arriving at one square metre each second, reported as micromoles per square metre per second (µmol/m²/s). In practical terms, it is a snapshot of light intensity at a leaf, not a score for the entire lamp.
PPFD sits inside a simple three-part vocabulary:
| Term | What it describes | Why a Monstera grower needs it |
|---|---|---|
| PAR | The band of light plants can use for photosynthesis | Tells you which wavelengths a sensor or fixture is discussing; it is not an intensity value by itself |
| PPFD | Photons arriving at a point each second | Lets you compare the centre and edges of a fixture's footprint at one height and setting |
| DLI | The total daily light received over the light window | Connects PPFD with hours; the same PPFD for longer produces a larger daily total |
You can estimate DLI with DLI = PPFD × hours × 3,600 ÷ 1,000,000, provided the PPFD value is representative of the leaf area and remains reasonably steady. The calculation is a planning aid, not permission to run a lamp around the clock. Monstera also need a dark period, and their response depends on water, temperature, roots, and acclimation.
Lux is different again. It weights light for human vision, so two fixtures with different spectra can show different lux readings while delivering similar plant-usable photons. A phone lux app can reveal whether one side of a canopy is dramatically darker, but it should not be treated as a universal PPFD conversion.
Which parts of a PPFD chart should you read first?
Read the test conditions before reading the colourful numbers. A useful chart states the mounting height, dimmer setting, measurement plane, fixture orientation, and sometimes the test-room or reflector details. Without those conditions, the numbers cannot be reproduced.
Then identify four visual elements:
- The measurement grid. Rows and columns represent positions across a floor, shelf, or canopy plane. The spacing may be in inches or centimetres; note the scale before comparing two maps.
- The legend or contour bands. Colours show ranges of PPFD. A bright central colour is not automatically the correct value for every leaf; it may mark a small hotspot.
- The fixture outline and centre line. These help you orient the map. A bar's long axis and a panel's rectangle should be aligned with the canopy you intend to cover.
- The distance and output state. A chart at one height and 100% output is not the same claim as a chart at another height or 50% dimming.
Look for whether the map is measured on a flat surface or over a plant. A flat map describes the fixture's field without leaf overlap. Real Monstera leaves sit at different angles and shade one another, so use the map to choose a starting geometry and then observe the actual canopy.
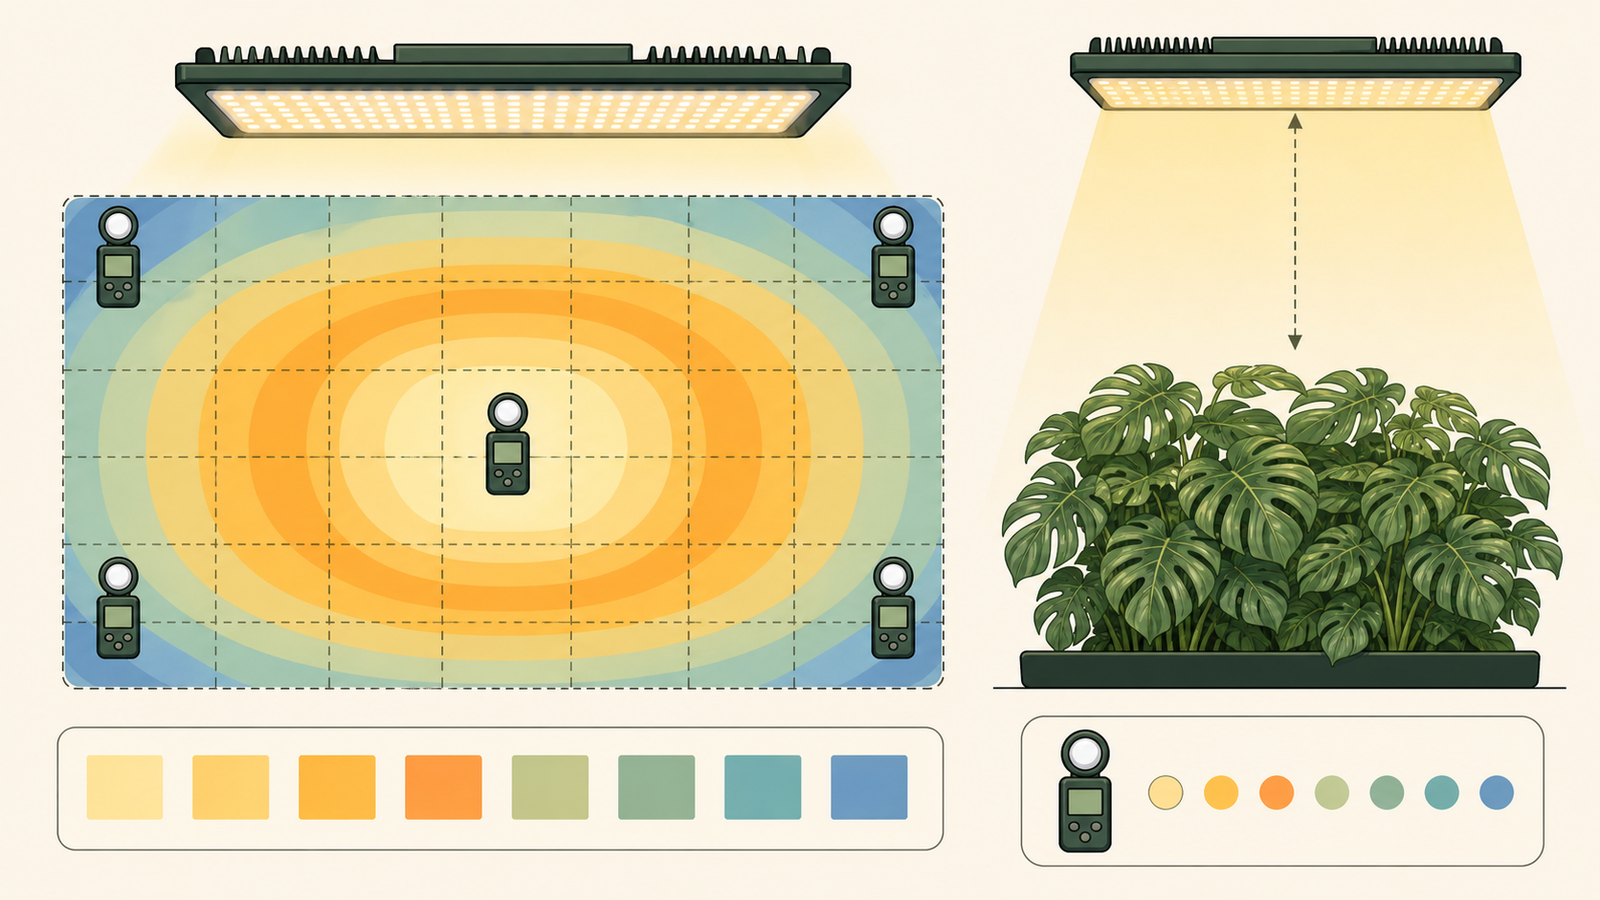
Read the centre, edge, and distance information together instead of relying on one peak number.
How do distance and mounting height change the chart?
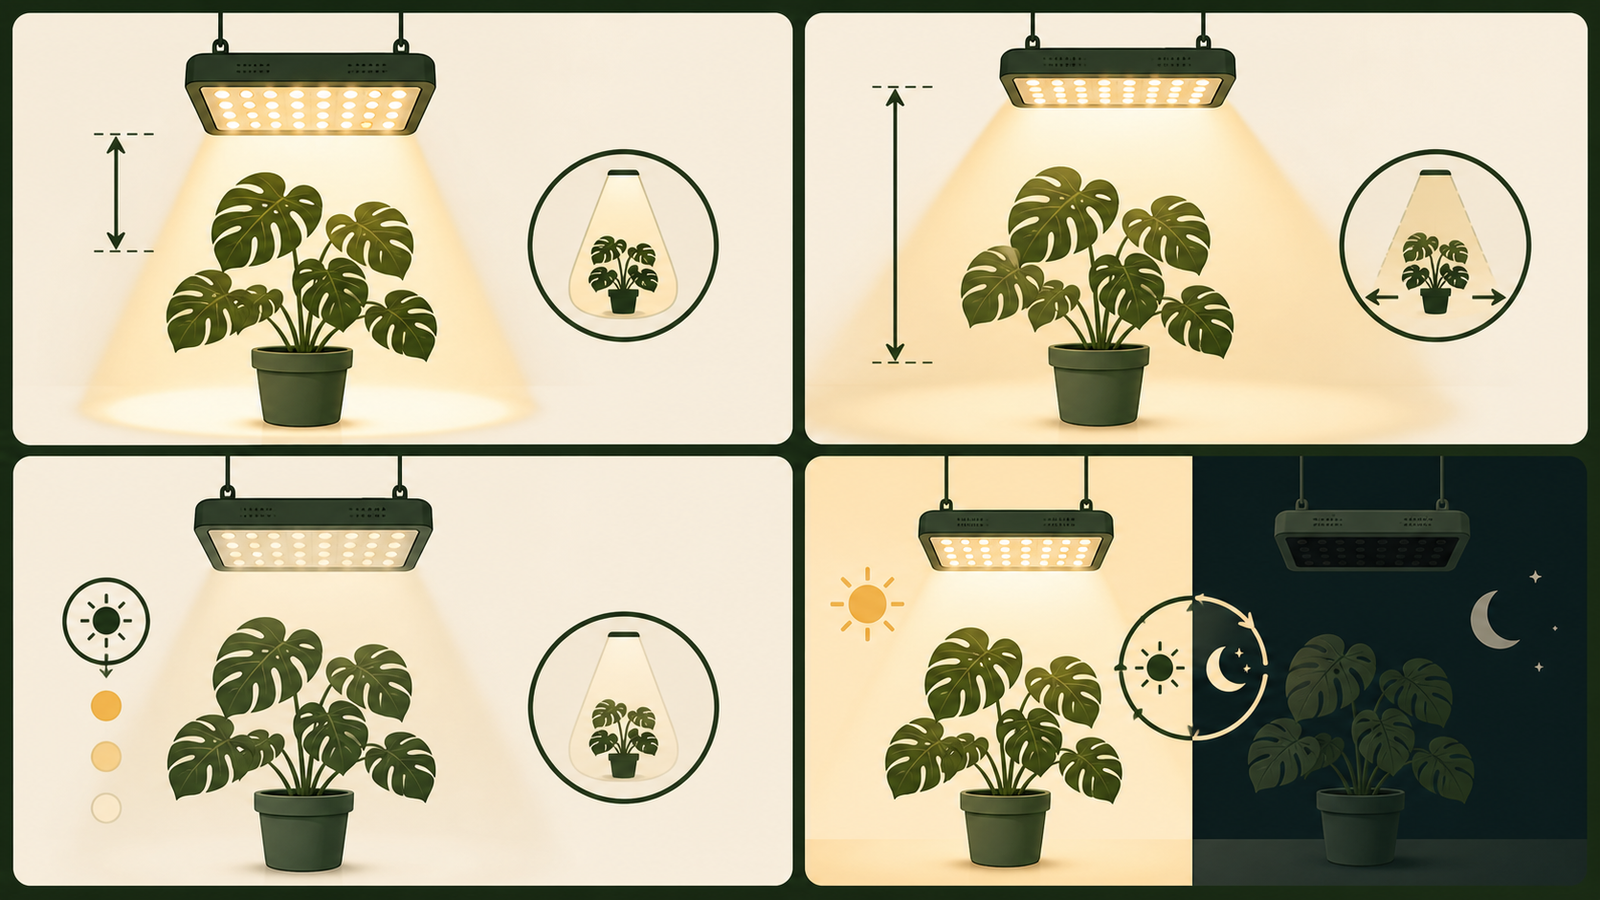
Distance changes both intensity and footprint. Moving a light closer usually creates a stronger centre and a tighter usable area; moving it higher spreads photons over a wider area but lowers the reading at each point. The exact change depends on the optics, diffuser, reflector, and fixture size.
Use the manufacturer's recommended distance first. The often-repeated 12–24 inch range is only an initial reference when a listing gives no chart or setup guidance; it is not a universal Monstera rule. Measure from the light-emitting surface to the nearest leaves, not from the ceiling or the top of a stand. For a climbing plant, record the distance to the active growth point as well as to lower leaves.
If a chart provides several heights, compare the same grid positions at each height. Ask whether the wider field at the higher position actually reaches the outer leaves, and whether the lower intensity can be balanced with a safe dimmer setting or a suitable light window. Do not make a narrow chart “work” by extending the timer indefinitely; repair coverage first.
Mounting angle matters too. A panel tilted toward a window may illuminate one side while leaving the far side weak. A bar rotated across the canopy can distribute light differently from a bar aimed along it. Include the bracket, reflector, and diffuser in your mental model, because the advertised map may not represent an improvised shade or a different lens.
How do you compare center, edge, and average values?
Use the centre value to find a potential hotspot, the edge values to judge coverage, and the average (if provided) to understand the overall field. A high peak with very dark corners may be a poor match for a wide Monstera, even if the product title calls it powerful.
| Chart detail | What it tells you | Why it matters for Monstera | Question to ask before buying |
|---|---|---|---|
| Peak or centre PPFD | The brightest measured point | The newest or highest leaf may sit here and show stress first | Is the centre small enough that most leaves will not be forced into the hotspot? |
| Edge or corner PPFD | How quickly the field falls off | Outer leaves and lower nodes often live at the edge | Does the edge still provide a useful, even starting point for the whole canopy? |
| Average PPFD | A summary across the stated grid | Helps compare broad fixtures, but can hide gaps | How large is the grid, and are the values averaged over the area I actually need? |
| Uniformity or min/max ratio | How even the map is | Evenness reduces the need to chase one leaf with the lamp | Is the ratio calculated from all points or only a selected inner zone? |
| Footprint dimensions | The area covered at that test height | Determines whether a bulb, bar, or panel fits the plant's width and depth | Are the dimensions larger than my current canopy, with room to grow? |
For a fair comparison, trace your own canopy on paper or in a phone photo. Mark the centre of the fixture over the growth point, then overlay the chart's grid. If the plant is tall, make a side-view sketch too; a top-down rectangle can conceal that the upper leaves shade the lower ones.
How should dimming and light hours change your reading?
Dimming changes PPFD at the leaves, while hours change DLI. Treat them as separate controls. If the fixture's chart is at full output, a lower setting may reduce every point, but the centre-to-edge pattern usually remains. If the chart has no dimmer data, do not assume a precise percentage relationship; use a meter or conservative observation instead.
Suppose a manufacturer gives an illustrative map at one height: centre 420, inner leaves 300, edge 150 µmol/m²/s. Those are invented values for explaining the method, not a product specification. At 50% output, you might expect a lower field, but the safest decision is to verify the actual reading and watch the closest leaves. If your canopy is only as wide as the inner zone, the fixture may fit; if it fills the full edge-to-edge map, you need to evaluate the weaker perimeter.
When planning hours, use the DLI formula with an average or representative canopy value rather than the peak. A light that supplies a moderate, even field for a consistent window can be more useful than a bright centre used for a short, irregular burst. Iowa State Extension recommends a repeatable supplemental-light schedule with a dark period and observation over time.3
Account for window light separately. On a bright day, the grow light may fill only the shaded side; on a cloudy day, it may carry more of the daily load. Keep the timer predictable, and adjust one lever—height, dimming, or duration—after you have observed the existing setup.
How can you compare two fixtures fairly?
Put both products on the same measurement basis before declaring a winner. Use this sequence:
- Normalize distance. Compare maps at the height you can safely maintain above the tallest leaf. If one listing uses 12 inches and another 24 inches, find an equivalent chart or acknowledge that the comparison is incomplete.
- Normalize output. Note whether each map is full power, a named dimmer level, or an unknown setting. Record wattage only as an electrical and heat consideration, not as a light-intensity substitute.
- Normalize area. Draw the same canopy rectangle over each map. A panel may have a larger total footprint; a bar may fit a narrow shelf more evenly; a bulb may show a strong centre but weak corners.
- Compare the useful zone. Check centre, near-edge, and corner values, plus any uniformity metric. Do not let a single maximum decide the purchase.
- Check practical constraints. Include mounting hardware, heat clearance, glare, timer compatibility, cable routing, and the ability to raise the fixture as the Monstera climbs.
The format comparison in the Monstera grow-light guide is a useful companion when you are deciding whether that map belongs to a bulb, bar, or panel. A good chart is only useful if you can recreate its placement without blocking a walkway or placing a power connection in the splash zone.
What red flags make a PPFD chart hard to trust?
Treat a chart as incomplete when it omits the conditions needed to interpret it. Common red flags include:
- only a wattage claim and no PPFD map, units, distance, or sensor plane;
- one spectacular centre number with no edge, corner, or average values;
- a coloured graphic with no legend or grid scale;
- charts copied across several products despite different optics or fixture sizes;
- no indication of dimmer output, lens, reflector, or diffuser state;
- a “coverage” area that does not say whether it means growth, brightness, or a marketing estimate;
- promises of universal results for every plant, room, and mounting height.
Ask the seller for a complete map or choose a product with transparent test data. Even a legitimate map will not predict your exact room: white walls reflect, dark furniture absorbs, leaves overlap, and a nearby window changes the baseline. The map should improve your decision, not replace observation.
How do you test the chart in your own room?
Run a controlled trial for at least a week before making a second purchase or a major output change. The goal is to see whether the published geometry translates to your leaves.
- Photograph and measure. Record canopy width, height, newest leaf, and the distance from the fixture to the closest and farthest leaves. Note the window direction and curtain position.
- Place the fixture conservatively. Start at the manufacturer's distance and output guidance. Use a stable stand or rated suspension, and keep every cord away from runoff.
- Check three zones. During the light window, inspect the leaf nearest the centre, a middle leaf, and an outer or lower leaf. Look for a dramatic brightness gradient, glare, or a beam that misses the growth point.
- Check heat and dry-down. Feel the closest leaf after the light has run and weigh the pot or check the substrate before watering. Brighter, warmer, or better-ventilated corners can dry faster; watering should follow the root zone, not a fixed calendar.4
- Log plant response. Note leaf angle, new growth, crisp or bleached patches, pests, room temperature, and humidity. Large Monstera leaves can burn after abrupt exposure, so acclimate rather than jumping from a dim room to full output.2
- Change one lever. If the edges are weak, first adjust height, aim, dimming, or fixture length—one at a time. Hold the new setting for several days before interpreting the next change.
This process also catches a lifestyle mismatch. A panel that produces a beautiful chart but shines into your bed may be harder to run consistently than a bar with slightly less peak output. Consistency, safe mounting, and a preserved dark period are part of the light's real performance.
What should you check before changing the light?
Confirm that light is actually the limiting factor. Monstera deliciosa is generally described as a moderate-light foliage plant, and abrupt direct exposure can damage leaves.1 A leggy stem or slow leaf may reflect insufficient usable light, but yellowing in a wet pot, root damage, pests, temperature swings, or poor support can look similar.
Use the Monstera light requirements guide to separate low-light clues from stress symptoms. Then review the complete indoor Monstera care guide for drainage, roots, watering, humidity, temperature, and airflow. If the plant is climbing, a modular moss pole for climbing Monstera can keep the growth point in a repeatable position while you re-measure the chart.
Before increasing output, check leaf clearance, fixture heat, window overlap, and timer settings. Make a dated note of the current chart conditions and plant state. That record prevents you from reacting to one unusual afternoon and makes it easier to return to a stable setting.
Conclusion: buy the chart that matches your canopy
To read a grow light PPFD chart before you buy, verify the units and test conditions, match the grid footprint to your real canopy, compare centre and edge values, and account for distance, dimming, daily hours, and window light. Use the manufacturer's distance first; treat 12–24 inches only as a rough starting reference when no better guidance is available.
Choose the fixture whose useful zone covers the leaves you care about and whose mounting, heat clearance, glare, and cable route you can live with. Start conservatively, preserve a dark period, observe for a week, and change one variable at a time. Recheck the map whenever the Monstera grows or the season changes, then return to the Monstera grow-light guide for the broader setup sequence.
Frequently Asked Questions
Is a higher PPFD number always better for a Monstera?
No. A peak number describes one point under stated test conditions. An even field that covers the entire canopy may be more useful than a very bright centre with weak edges. Check plant response, heat, and acclimation as well as the chart.
What does a PPFD chart's distance mean?
It is the measured distance from the light-emitting surface to the test plane, usually where leaves would sit. Match that reference to the closest leaves in your setup and follow the manufacturer's clearance instructions.
Can I compare two PPFD charts at different heights?
Not directly. First find maps at the same height or acknowledge that one fixture is being evaluated in a different geometry. Height changes both intensity and footprint, so normalise distance before comparing centre, edge, or average values.
How is PPFD different from DLI?
PPFD is an instantaneous rate in µmol/m²/s. DLI is the daily total and depends on that rate multiplied by the hours of light. Use a representative canopy value in the formula, keep a dark period, and include daylight entering through the window.
Can a lux meter replace a PPFD meter?
No. Lux is weighted for human vision and varies with spectrum. It can reveal unevenness or a major change between positions, but it cannot reliably convert every LED spectrum into plant-usable PPFD.
What if the manufacturer publishes only wattage?
Ask for a PPFD map with distance, output, grid scale, and units. If the seller cannot provide one, treat coverage as uncertain and choose a fixture with transparent data rather than guessing from watts.
Should I run the grow light longer to fix dark edges?
Usually fix the geometry first. Aim the fixture, raise it, add length, or change the format so the canopy is covered more evenly. Extending hours to compensate for a narrow hotspot can increase daily exposure without solving the shaded leaves.
How quickly should I change a new light?
Begin at the manufacturer's conservative distance or dimmer setting and acclimate over several days. Watch the closest leaves for heat, bleaching, crisp margins, or persistent curling, and change one variable at a time.
References
- North Carolina Cooperative Extension: Monstera deliciosa (Ceriman, Cutleaf Philodendron, Hurricane Plant) — Moderate-light guidance, direct-sun caution, and cultivar context. 2026.
- University of Connecticut Home & Garden Education Center: Monstera deliciosa — Acclimation, leaf-burn risk, and indoor-care context. 2020.
- Iowa State University Extension and Outreach: How to Set Up Supplemental Lights for Indoor Plants — Supplemental-light placement, observation, timers, and dark periods. 2026.
- University of Minnesota Extension: Lighting for Indoor Plants and Starting Seeds — Indoor light categories and how brighter, warmer locations can affect drying speed. 2026.